
ArchiveSponsored
All About 32Red Casino
Discover everything you need to know about 32Red Casino, from game variety to bonuses and payouts.
5 min read
10 min read

Photo: Financial newspaper from Norway regarding successful fund raising in SSI — Hansibansi133, CC BY-SA 4.0. Wikimedia Commons.
In seven minutes, you will see past the headlines. You will learn how money flows in gambling, who really pays, what jobs stick, what harms cost, and how to read claims like an economist.
One night, the local news says a new casino will save the town. Jobs. Schools fixed. Roads paved. Smiles all around. The next night, a different channel shows people in debt, dark shop fronts, and a fear that the old main street will not come back. Both stories feel true. Both are too simple.
This article looks at what the media often miss. Not to cheer or to scare, but to check the math. We will ask: who gains, who pays, and what leaks out. We will use public data. We will show limits. And we will point you to help if you need it.
Here are common lines you hear, and what the best data tends to show.
“Casinos mean a boom in money.” Often, yes, in total sales. But growth in gross gaming revenue is not the same as growth in real value added or household welfare. See the latest U.S. casino revenue snapshot for scale, then adjust for taxes, imports, and what locals would have spent on other fun.
“This industry is the same everywhere.” No. Game mix, tax rates, and player base differ a lot by market. You can scan the UK industry statistics and compare them to U.S. and EU trends and see how paths split.
“Problem gambling is rare, so costs are tiny.” Prevalence is small, but harms cluster and spill over to families and work. The what is gambling disorder page by the American Psychiatric Association shows why the small share can still drive large social costs.
Think of a simple dollar of gross gaming revenue (GGR). From that dollar, tax takes a slice, staff get wages, suppliers get paid, owners get profit, and some money leaves town. The key idea is incidence: who ends up paying the tax or fee in real terms. With gambling, much of it is paid by players through the house edge, which is why “new money” can feel like a transfer, not a pure gain.
Sin taxes look easy to raise, but they behave in tricky ways. Demand can be sticky for some games and elastic for others. High rates can push people to other fun or to the grey market. The Brookings explainer on how sin taxes behave is a clear primer on this point.
Not all gambling tax is the same. Duties on machines, levies on GGR, and fees on licenses hit different parts of the chain. The UK’s UK machine games duty receipts series shows how machine play can swing the total and how policy changes shift mix.
Leakage matters. Tourist hubs pull in out‑of‑town spend and export tax to visitors. Local casinos recycle more within the county but also displace other leisure: restaurants, shows, sports. Historic tables at the UNLV Center for Gaming Research datasets let you see long runs by state and game, and think through who the final payer is.
Use this table as a quick map. “Media claim” is a line you may hear. “What it omits” is the hidden part. “What the data shows” gives the range you often find across mature markets. “Primary source” names where these numbers come from; see full links in the Sources section.
| Casinos create net new jobs | Seasonal swings and shift from other local leisure | Tourist hubs show higher multipliers; local markets see job gains but also displacement; seasonal variance can be high in resort towns | UNLV, BLS |
| Lotteries painlessly fund schools | Regressive spend and substitution from other sales | Lower‑income players over‑index; some funds replace, not add to, school budgets | Brookings, HMRC |
| Legalization kills illegal markets | Role of tax rate, game mix, and ad rules in channelization | Moderate taxes and access shift play on‑shore; very high levies can leave a large grey share | EGBA |
| Problem gambling is rare, so costs are tiny | Severity bands and spillovers to families and work | Prevalence small but harm per case high; health, debt, and productivity costs cluster | NCPG, Productivity Commission |
Note: each figure is a range by market and time. GGR, tax, and jobs react to policy and mix. For a local read, use state or national reports, and check the date and method.
Jobs in casinos sit inside the wider leisure and hospitality world. To read claims on “employment,” first scan the leisure and hospitality jobs data. You will see that many roles are shift‑based, part‑time, or tipped. Resorts add hotel, food, shows, and security. Local rooms may be more slots and less live events.
Tourist hubs get a clear boost when they open or expand. The mix includes dealers, cage staff, cleaners, cooks, and techs. But headcount often swings with holidays, sports events, or big conferences. In small markets, a new casino can pull staff from nearby bars and venues. That is not a net gain for the area; it is a shift in where the paycheck comes from.
To track the scale of a local boom or dip, read monthly filings. Nevada’s monthly gaming revenue reports pair well with hotel occupancy and flights. When rooms fill, casino floors fill. When rooms thin, tables and buffets cut hours. Jobs follow that wave.
What about pay? Wages depend on tips, hours, and role. Dealers with steady high‑limit play can do well; graveyard slot techs in off‑peak towns, less so. Benefits vary by operator. Strong unions can lift pay and training. Small rooms may have tighter budgets. When you see “average wage,” ask for the spread, not just the mean.
Media often quote gross tax and jobs. They rarely price harm. Start with how common problem play is. The problem gambling by the numbers page shows a small share of adults meet risk or disorder screens in a given year, but costs per case can be high.
Harms are not just money. They include anxiety, family stress, lost time at work, and in bad cases, crime or self‑harm. For a simple, plain guide for people and families, see the NIH’s gambling health resource. It covers signs, comorbidity with mood and substance issues, and where to find help.
How big are the costs? The Australian 2010 Gambling inquiry report is a landmark. It found that while most people play with no serious harm, the minority with severe harm drive a large share of social cost. The exact dollars differ by place and time, but the pattern holds.
We also have good work from New Zealand’s public health team. Their gambling-related harm overview sets harm in a wider frame: families, culture, and place. The point is clear. A budget line cannot see all the pain or all the help that communities give for free.
Many stories treat “legal vs illegal” like a light switch. In truth, it is a dial. The share of play that moves on‑shore depends on tax, access, product, and trust. If legal sites are safe, fair, and not over‑taxed, more people pick them. If not, grey sites stay busy.
Europe’s online market is a live case. The European Gaming and Betting Association tracks it each year. See their key facts on Europe’s online market. You will notice that moderate tax rates and clear ad rules tend to raise channelization. Very high rates can do the reverse by pushing price‑sensitive play off‑shore.
Good policy is not just “permit or ban.” It is also “how to tax, how to check age, how to treat ads, and how to audit fairness.” Smart rules help pull play into places where consumer law and help lines work. That is good for players and for the tax base. Bad rules can chase play away and cut both.
One more policy trap: states love “sin taxes” to plug budget gaps. But they rise and fall with the cycle, and they can hit lower‑income groups more. For a clear, data‑led view, see Pew’s brief on states and sin taxes.
Start with hold and RTP. Hold is the share the house keeps from total bets. RTP is the share that returns to players in the long run. A game with 96% RTP still can swing fast in the short run. Ads that say “up to” on bonuses often hide the real cost.
Now look at bonuses. The key is rollover. If a $100 bonus has 25x rollover on bonus plus deposit, you must bet $5,000 to clear. Your expected loss while you turn over is hold x required bets. On 4% hold, that is about $200. The “free” $100 is not free. Read the fine print.
Before you sign up, scan an independent review. Check payout speed, bonus rules, dispute history, and if RTP is stated. A good place to start is a balanced list of casinos with free spins. Use it as due diligence, not as a push to play; compare terms side by side, and walk away if they are vague.
Both effects show up. Big spikes happen at launch. After that, jobs track tourism and local demand. Net gains are higher in tourist hubs than in small local markets.
Not always. In many places, lottery funds replace, not add to, normal school budgets. Also, lower‑income players spend a higher share, so the tax is regressive.
GGR is what players lose before costs. Added value is what the sector adds to GDP after paying for inputs. They are not the same number.
Often, clear rules and limits help, but if legal sites cannot inform at all while grey sites can, channelization can slip. Balance matters: access to help, clear warnings, and moderate rules.
Gambling can raise tax and jobs, but gains are uneven and can move with the season and with tourists. Harms are real and cluster in a small share of players, with large spillovers. Policy design shapes where the money flows and where people play. Good analysis keeps totals and nets apart, checks who pays, and does not skip the parts that do not show up in line items. If a headline sounds too clean, read the footnotes.
If you feel worry, talk to someone you trust and seek help. It is free and confidential in most places.
Method: This piece uses primary public sources: regulators, national stats, and major research bodies. We favor dated, citable tables and long‑run series. Where results vary by place, we say so. Figures are current at the time of update below.
Author: This article was written by an economics researcher with experience in market analysis and public policy. Past work includes reports on tax incidence, leisure markets, and harm reduction. Contact and profile are available upon request.
Disclosure: We link once to an independent review website to help readers compare terms. There is no paid placement, and this is not an invite to gamble. We do not take a fee for clicks from this page. Editorial control stays with the author.
Updated on: 2026‑07‑28
Discover everything you need to know about 32Red Casino, from game variety to bonuses and payouts.
5 min read

Discover the key benefits of mobile casinos. Play Pennsylvania online casino games on your phone or tablet, enjoy casino apps for iPhone, claim free spins, deposit bonuses, and win jackpots…
3 min read
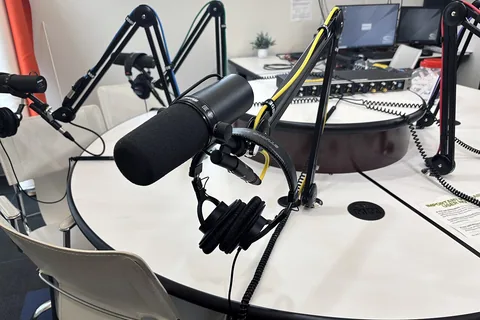
The studio is quiet, but the air feels tight. The host leans close to the mic. A late scratch drops five minutes before tape. The line shifts while the red light is on.
9 min read